Monitoring goesrecv with Circonus
Circonus is a hosted graphing and monitoring tool. It has native support for histograms which is ideal for looking at a distribution over time. For goesrecv in particular, this is great for keeping track of signal quality over time (e.g. distribution of Viterbi bit errors per packet, packet drops, etc).
For example, for my GOES-16 receiver, it enabled me to compare the performance of two different LNA configurations. Even though the new configuration has a worse mean error rate, it does not get overloaded when local interference happens, and leads to fewer packet drops.
Below you see the before and after graphs that show the distribution of Viterbi bit error rate and the number of packet drops. The before figure clearly has a lower mean bit error rate, but has really bad outliers, that in turn cause packet drop. The after figure has a higher mean bit error rate, but lacks the bad outliers, and has no packet drop at all.
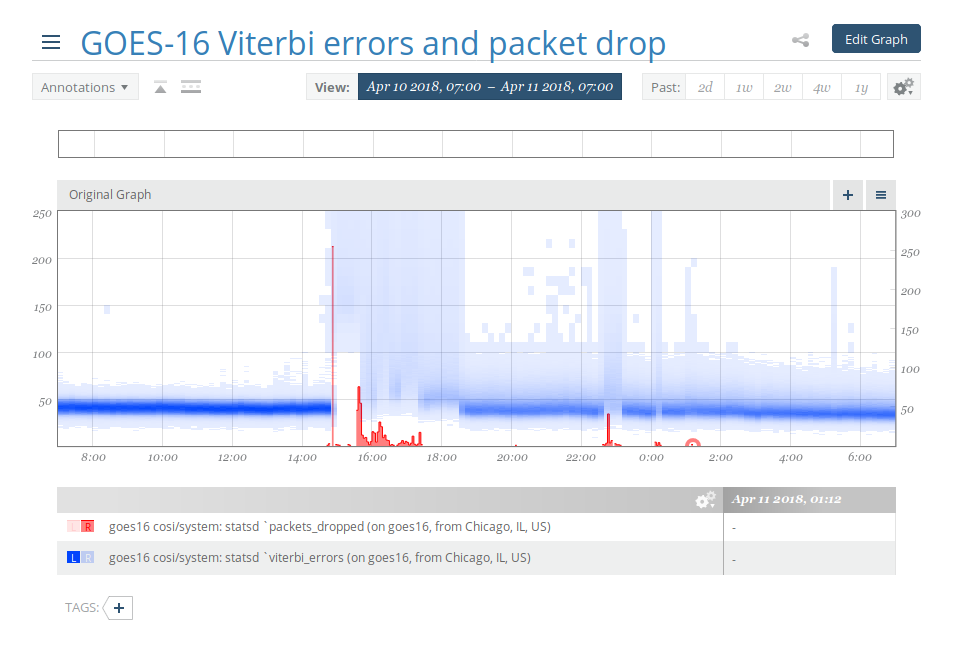
Before
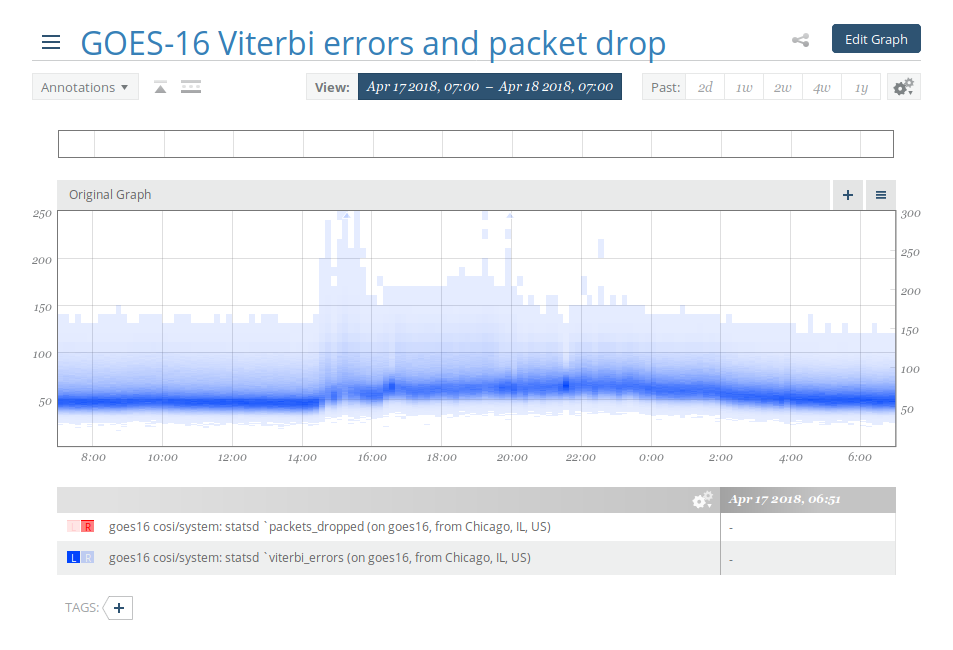
After
Setup
Register for a Circonus account and log in
Go to “new check”
Use the Circonus One-Step Install (COSI)
COSI installs an agent on your machine. The agent tracks a set of system metrics by default. It will also be the sink for the statsd stats produced by goesrecv and forward them to Circonus.
Setup on Raspbian
If you run goesrecv on Raspbian you have to install the agent yourself. See https://www.circonus.com/2018/02/circonus-raspberry-pi/ for instructions. These instructions include a fixed version of Node version 6, but newer versions have come out since. Find the latest version at https://nodejs.org/dist/latest-v6.x/ and modify the commands accordingly.
Note
Run uname -a on your Raspberry Pi to see if you need the
armv6l or arvm7l binaries.
The instructions are missing a mkdir, run the following before starting:
sudo mkdir -p /opt/circonus/bin
If the agent is not yet running after the installation has finished, try the following:
sudo systemctl daemon-reload
sudo systemctl enable nad
sudo systemctl start nad
Configuration
The statsd listener in the agent is enabled by default.
Ensure that your goesrecv configuration contains the following:
[monitor]
statsd_address = "udp4://localhost:8125"
After both the agent and goesrecv have run for a minute or so, navigate to “Integrations”, then “Checks”, and then click on the check you just added. Then click on “View Check Details” and subsequently “Change Brokers & Metrics”. Here you can enable the goesrecv stats you care about.
Relevant demodulator stats:
statsd.gainstatsd.frequencystatsd.omega
Relevant decoder stats:
statsd.viterbi_errors(enable as histogram)statsd.reed_solomon_errors(enable as histogram)statsd.packets_okstatsd.packets_dropped